

Last updated: April 24, 2026
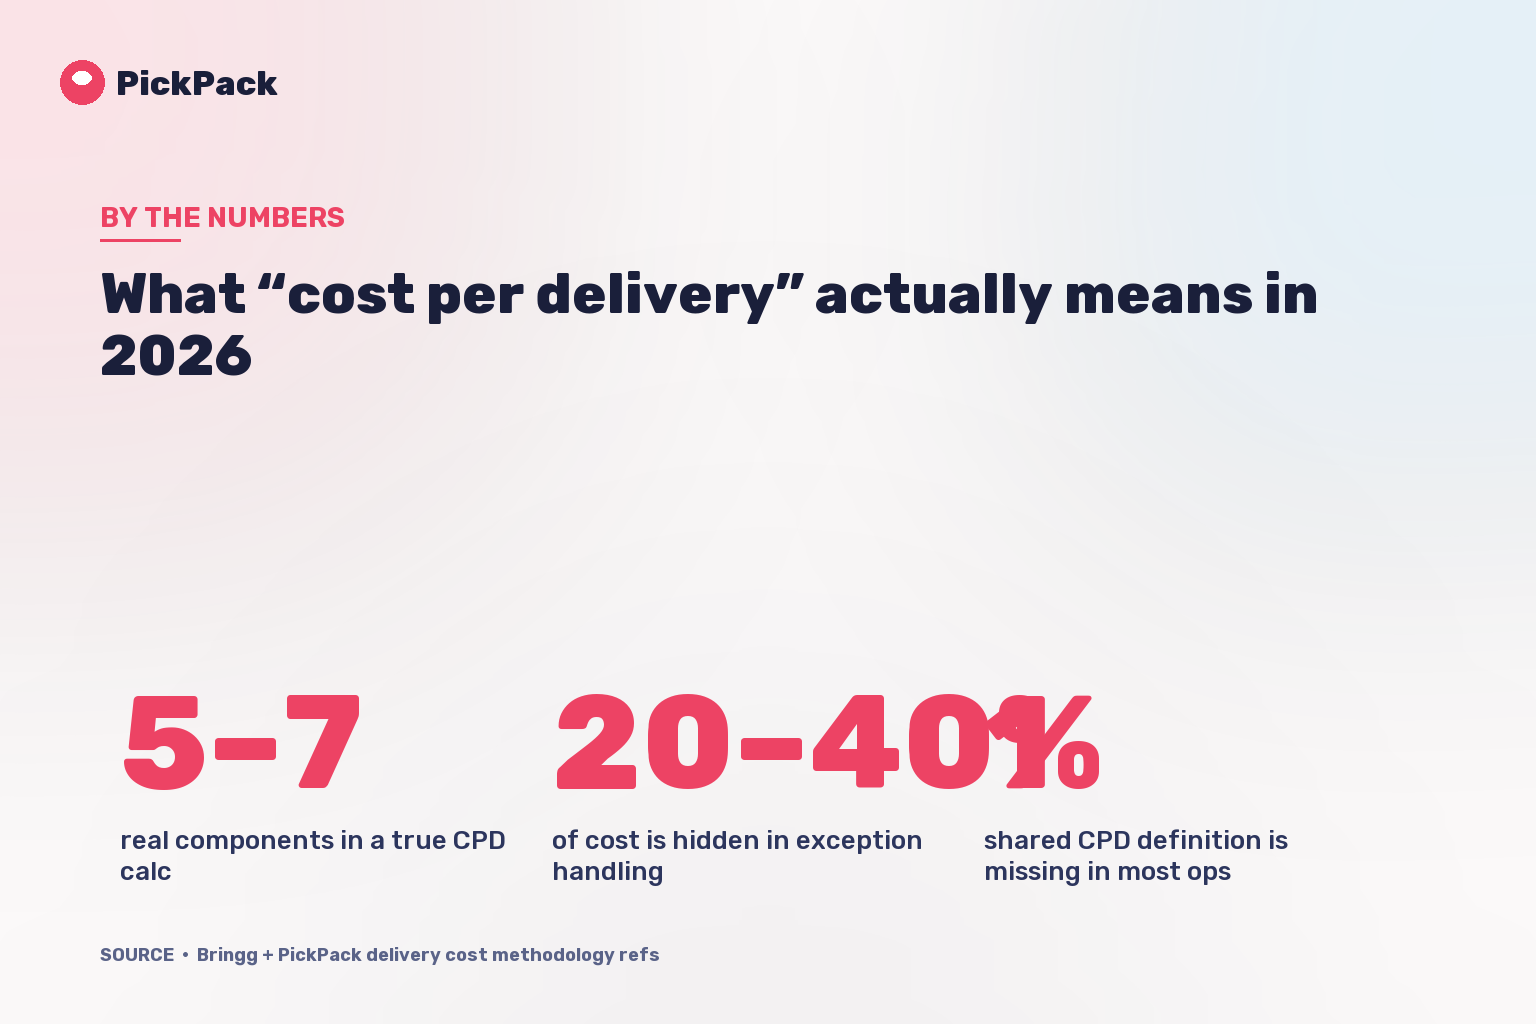
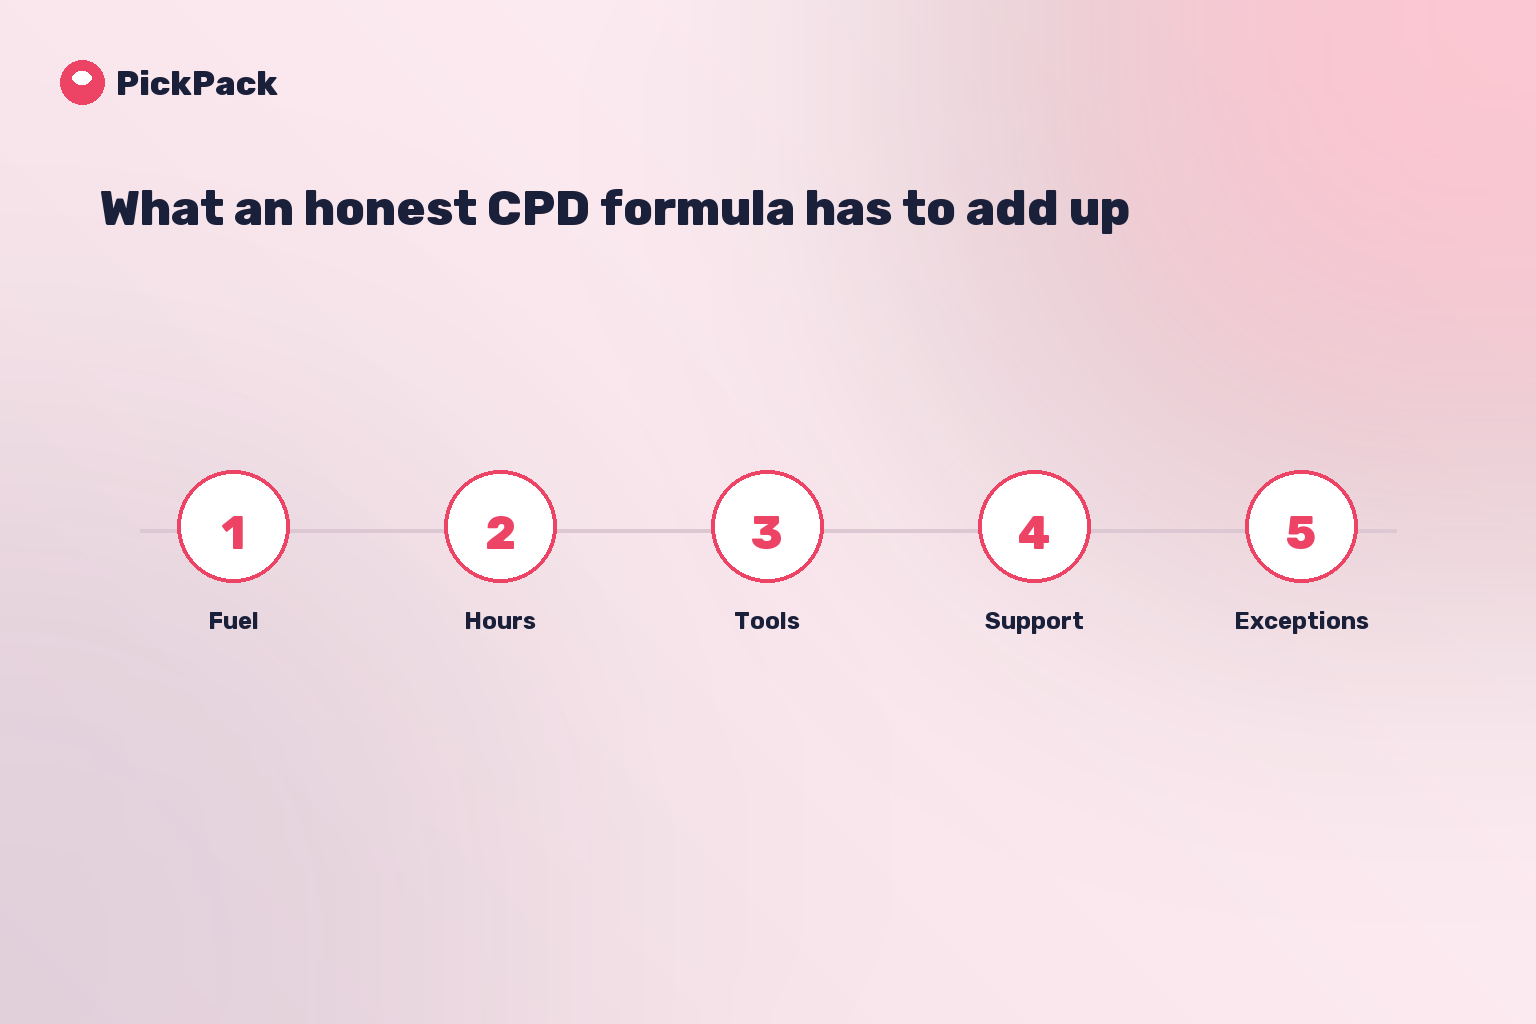
Too many teams still measure delivery cost through fuel, driver wages, or route-level spend alone. That is incomplete. The real cost per completed order also includes retries, support effort, wait time, route imbalance, capacity loss, and returns.
If those drivers stay hidden, an operation can look “optimized” and still erode margin every day. The right metric is not only cost per route. It is cost per successfully completed delivery at the order level.
What real cost includes
- Direct labor and vehicle cost.
- Drive time, wait time, and route imbalance.
- Retry, return, refund, and SLA failure cost.
- Support and control-tower effort spent on the order.

What Bringg gets right about shipping cost
Bringg’s guidance on reducing shipping costs focuses on two critical levers: miles per order and deliveries per route. That is important because cost improvement rarely comes from one negotiation alone. It comes from operational density and control. Bringg’s 2025 last-mile report also reinforces that delivery experience and cost remain tightly connected to commercial performance.
In other words, cost per delivery is not just a finance topic. It is a dispatch, routing, address quality, and service-execution topic.
How to calculate order-level cost
- Assign direct cost for driver time, vehicle time, fuel, and tolls.
- Allocate indirect cost for support, dispatch, and exception management.
- Add failure cost for retries, returns, credits, and unsuccessful handoff.
- Measure route productivity through stops per hour, miles per order, and service time per stop.
- Look at variance, not only averages, because certain zones or service types quietly destroy margin.
Why route planning still matters
Planning is not only about reducing kilometers. It also stabilizes workload and increases usable capacity. According to PickPack’s approved internal benchmarks, Rami Levy reduced delivery delays by 35%, cut kilometers by 18%, and achieved 12% more stops per shift at the same volume. Omer Deliveries cut planning time from 3.5 hours to 25 minutes.
That is the real connection between planning and profitability: more completed work from the same operational base.
What finance and operations should review together every week
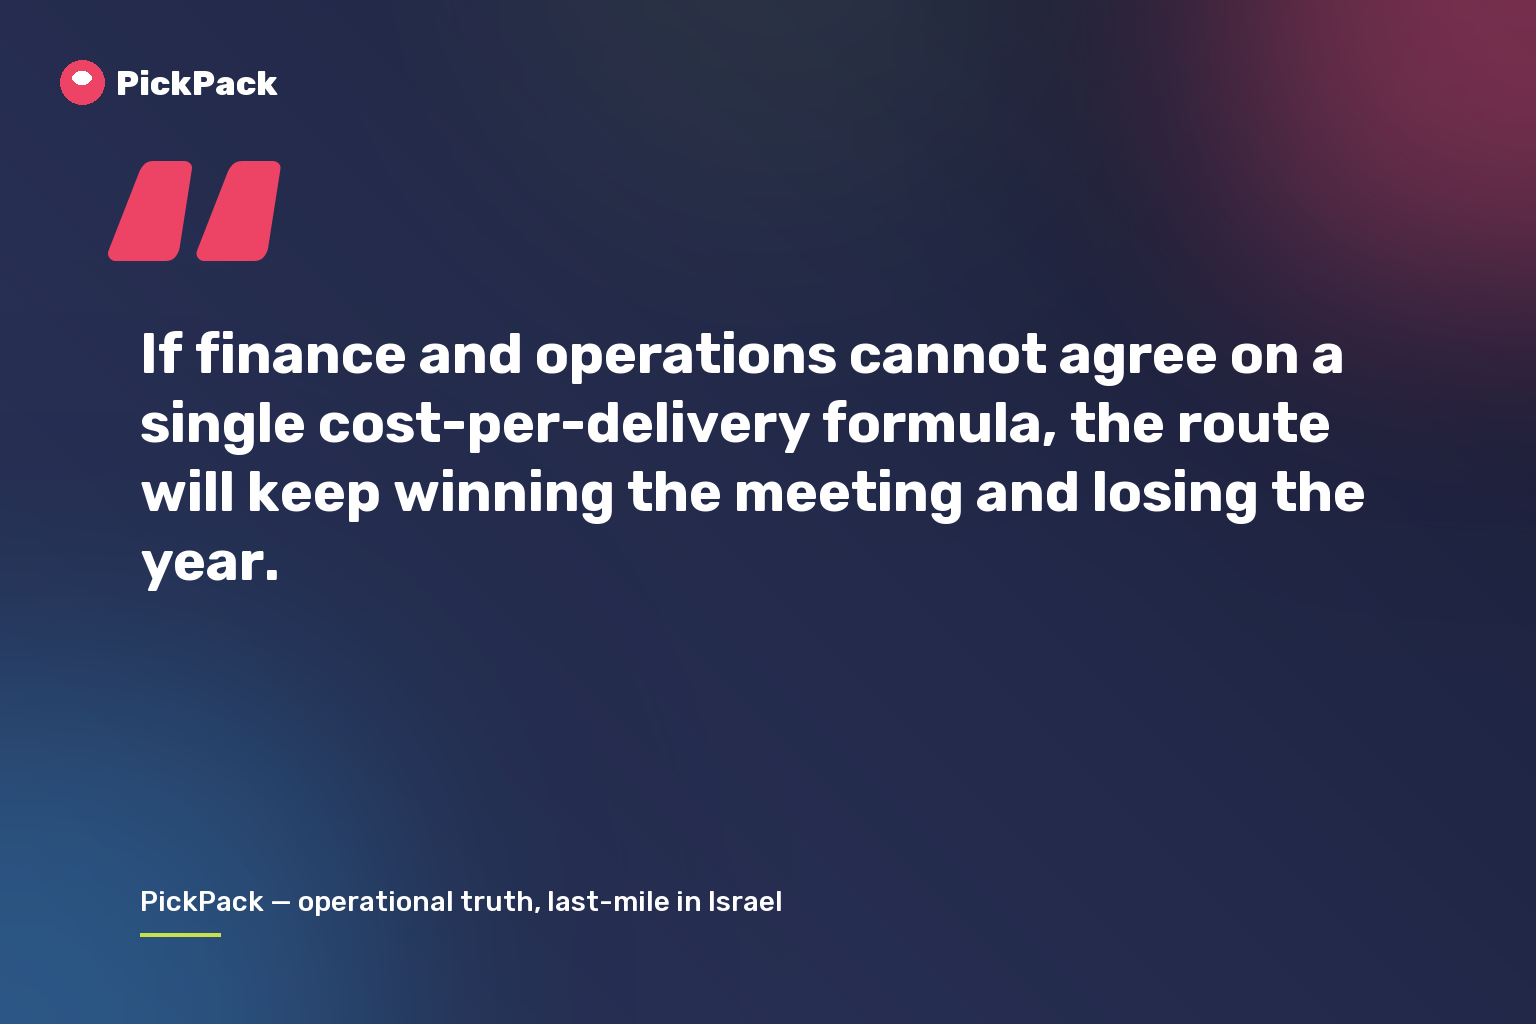
Margin usually leaks in the gap between teams. Finance sees invoices and budgets. Operations sees routes and late stops. Neither side sees the full picture unless they review the same order-level cost table together.
- Orders with retries: not just how many, but which customers or zones create them.
- Support minutes per order: because a cheap route can still create expensive customer-service load.
- Low-density routes: especially routes that leave with weak fill or too much service-time variance.
- SLA exceptions: because penalties and customer churn are real cost, even if they do not sit inside a transport invoice.
That weekly review is where route planning, dispatch discipline, and commercial margin finally connect.
What not to measure in isolation
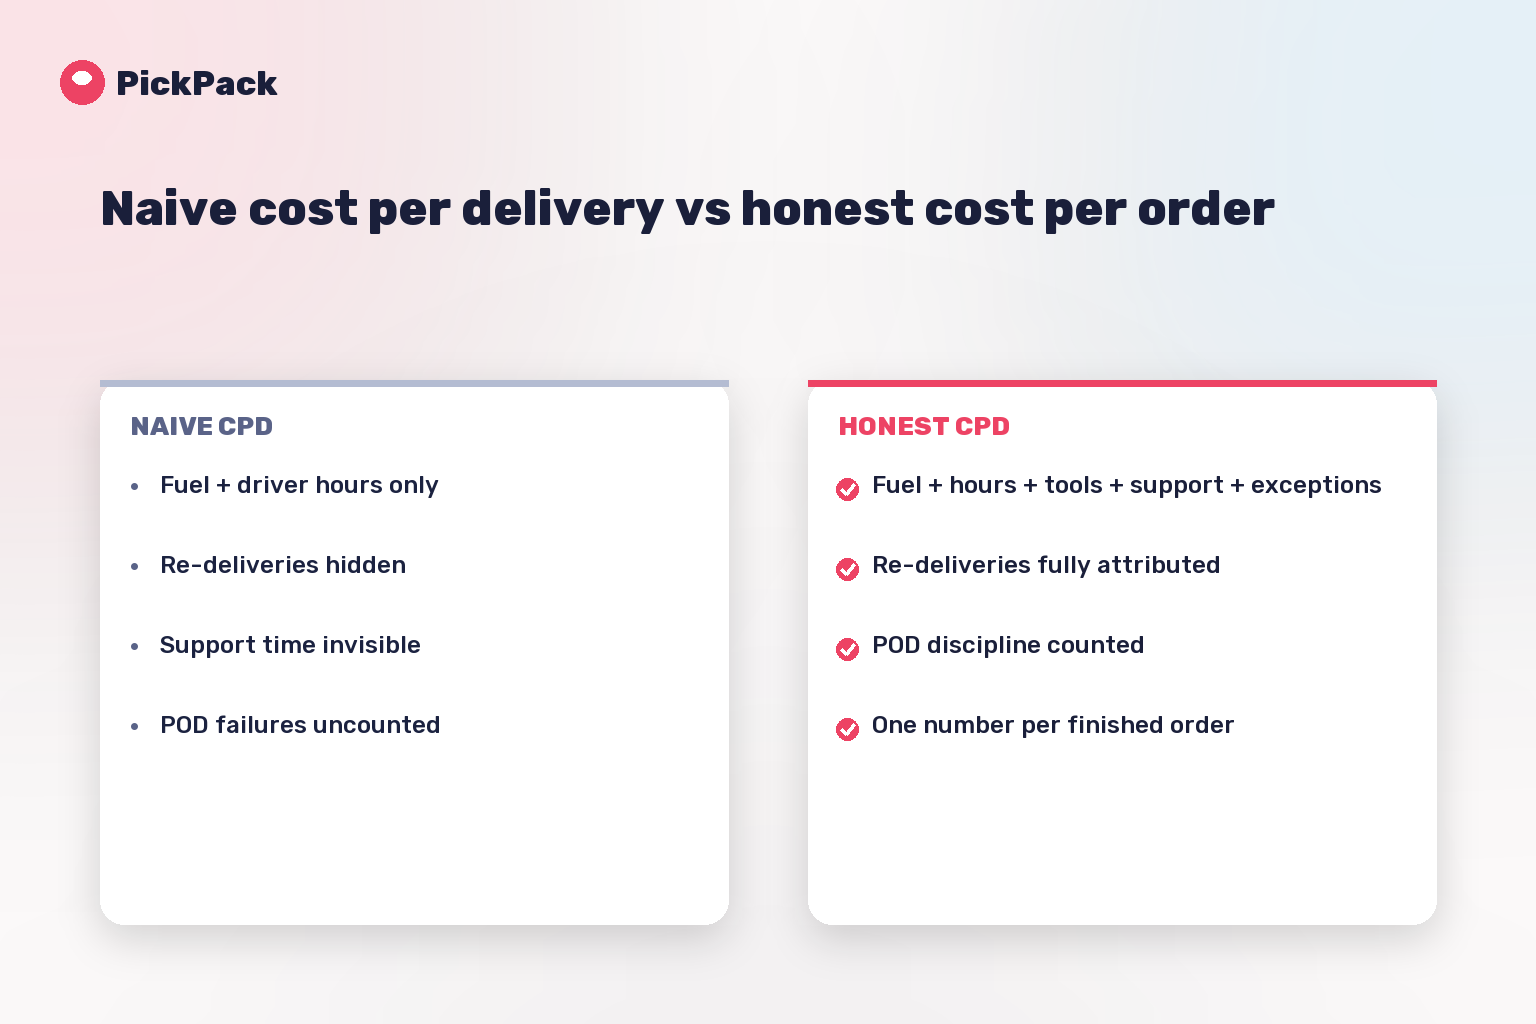
- Cost per route only: it hides bad order mix and poor density.
- Average package cost: it hides expensive exceptions and repeated attempts.
- Carrier invoice cost alone: it ignores support and service failure cost.
Related reading
FAQ
Cost per successfully completed order, viewed together with variance by zone, customer, and service type.
Because they hide the customers, areas, and service flows that quietly lose money.
Start with miles per order, stops per hour, service time, retries, and support minutes per order.